Business Service
Introduction
A business service is made up of many independent service components that works a one complete system. For ex: an ERP stack is a business service that uses SQL database, active directory, application server, apache HTTP server, firewall, routers, switches etc. All the components of a business service affect each other directly or indirectly. If one of the component goes down, whole system will be affected. Hence, it is important to monitor all the components of the service as a whole.
With Motadata’s Business Service/SLA (Service Level Agreement), you can monitor all the components of the business as a whole. It also calculates the business service target by evaluating the performance of each component.
Business Service Page
How SLA Works
SLA uses the key performance indicators (KPI) to determine the health of SLA. Each KPI has a threshold and set of monitors associated with it. Motadata constantly evaluates the monitors with the KPI threshold. An SLA can have any number of KPIs. When all the monitors are under the threshold value, the SLA is clear. When any monitor breaches the threshold value, the SLA comes under critical state.
SLA Benefits
Complete trend monitoring of your business operations
Offer child business service with nested Business Services Management (BSM)
Provide visualization by the gauge of BSM
More precise notifications on monitor network accessibility, server health, bandwidth usage, quality of network traffic, application and network performance
Preliminary notifications if network starts showing symptoms of bad health.
Detailed reports about network/device failures.
SLA Management gives you better visibility on how much you are meeting the needs of your customers
Standards based approach to manage IT resources, reduce operational costs and improve efficiency of IT services.
Ensure Timely Resolution
Create SLA(s) to ensure better service across all your networking devices
Configure separate SLA(s) for incidents and service requests.
Configure response time SLA(s) and appropriate Targets to ensure faster response to end users.
Configure business hours for the service level targets. You can choose high priority and high impact service level targets for 24/7.
Things to Note
When monitor is in maintenance mode, the SLA will take its previous state and carry forward it over the maintenance time.
To create a business service view, all service components’ monitors must be available and Alerts must be configured on them with desired performance attributes.
SLA Types
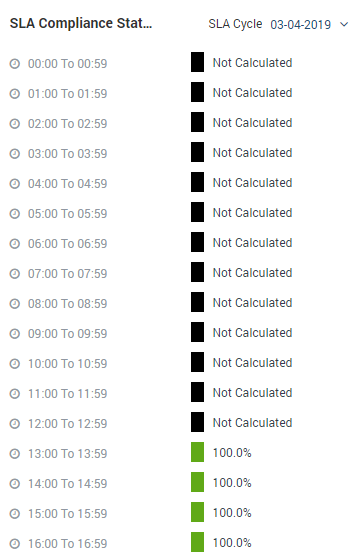
For Daily SLA, SLA compliance timeline is displayed based on 24 hour. On every SLA cycle Sla start date time will be change.
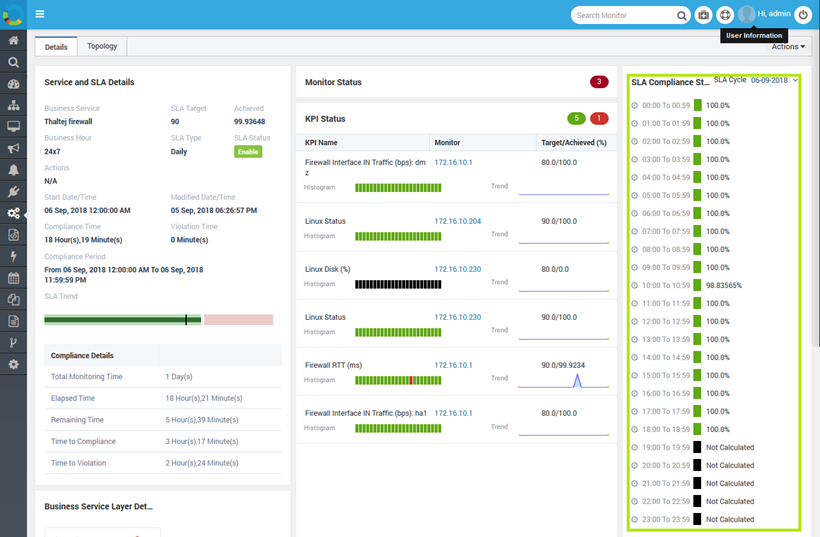
Daily SLA
For weekly SLA, SLA compliance timeline is displayed from the start day of the week. One widget having data of 24 hour.
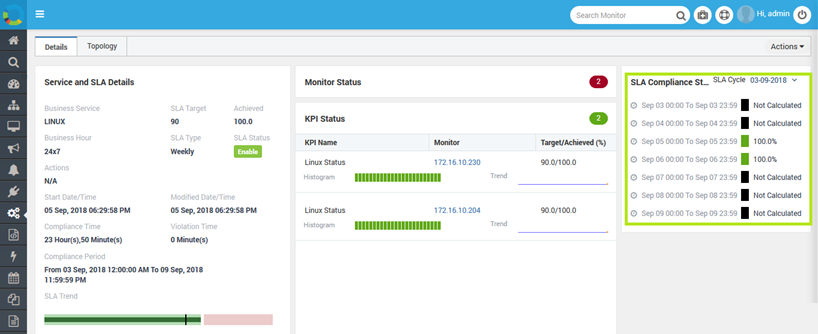
Weekly SLA
For Monthly SLA, SLA compliance timeline is displayed based on days coming in current month.
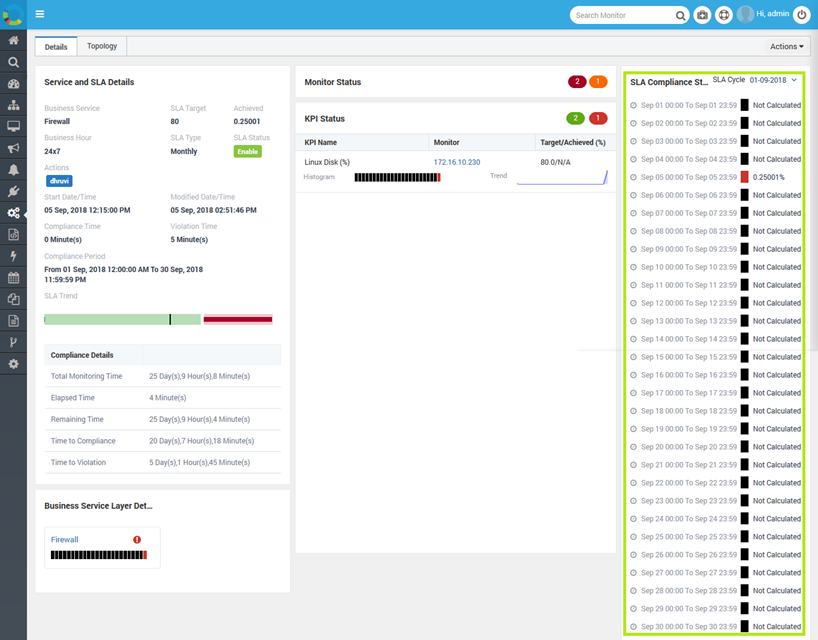
Monthly SLA
For Quarterly SLA, SLA compliance timeline is displayed based on 3 month’s quarter.
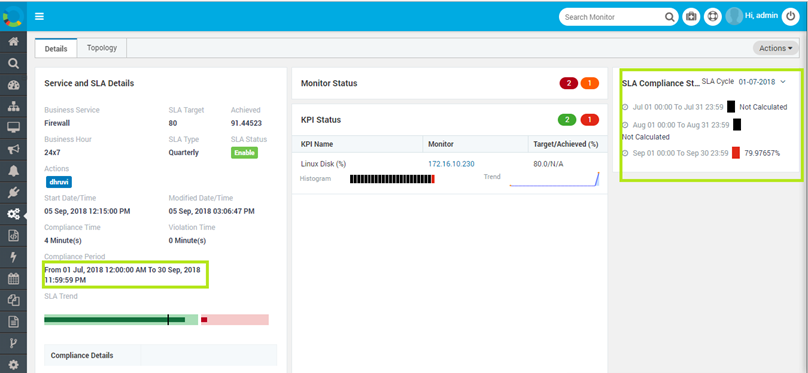
Quarterly SLA
SLA Dashboard
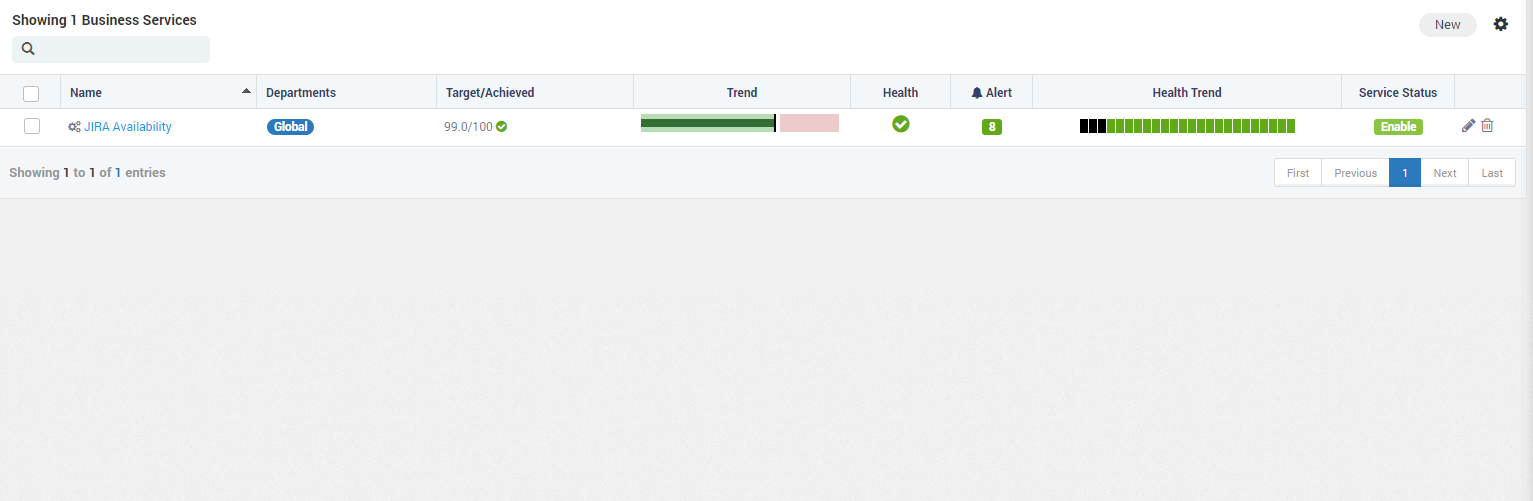
SLA dashboard shows the high level details about the SLAs.
Name: Name of the BSM
Departments: Department of that BSM. You can assign SLA to multiple departments while creating BSM.
Target/Achieved: SLA target which is set and target achieved (%) is displayed along with SLA State (Clear/Warning/Violated).
Trend: Displays the trend about target, achieved and violation.
Health: Health status of BSM (Clear or Critical) that is displayed based on highest alert severity.
Alert: No of alerts getting triggered on selected monitors. Alerts are in Clear or Critical state.
Health Trend: It displayed hourly (last 24 hours) health trend along with alert details. Click on the health trend to see details of business service and monitors in that hour.
Service Status: Shows that the business service is enabled or disabled.
Action: You can edit or delete the BSM.
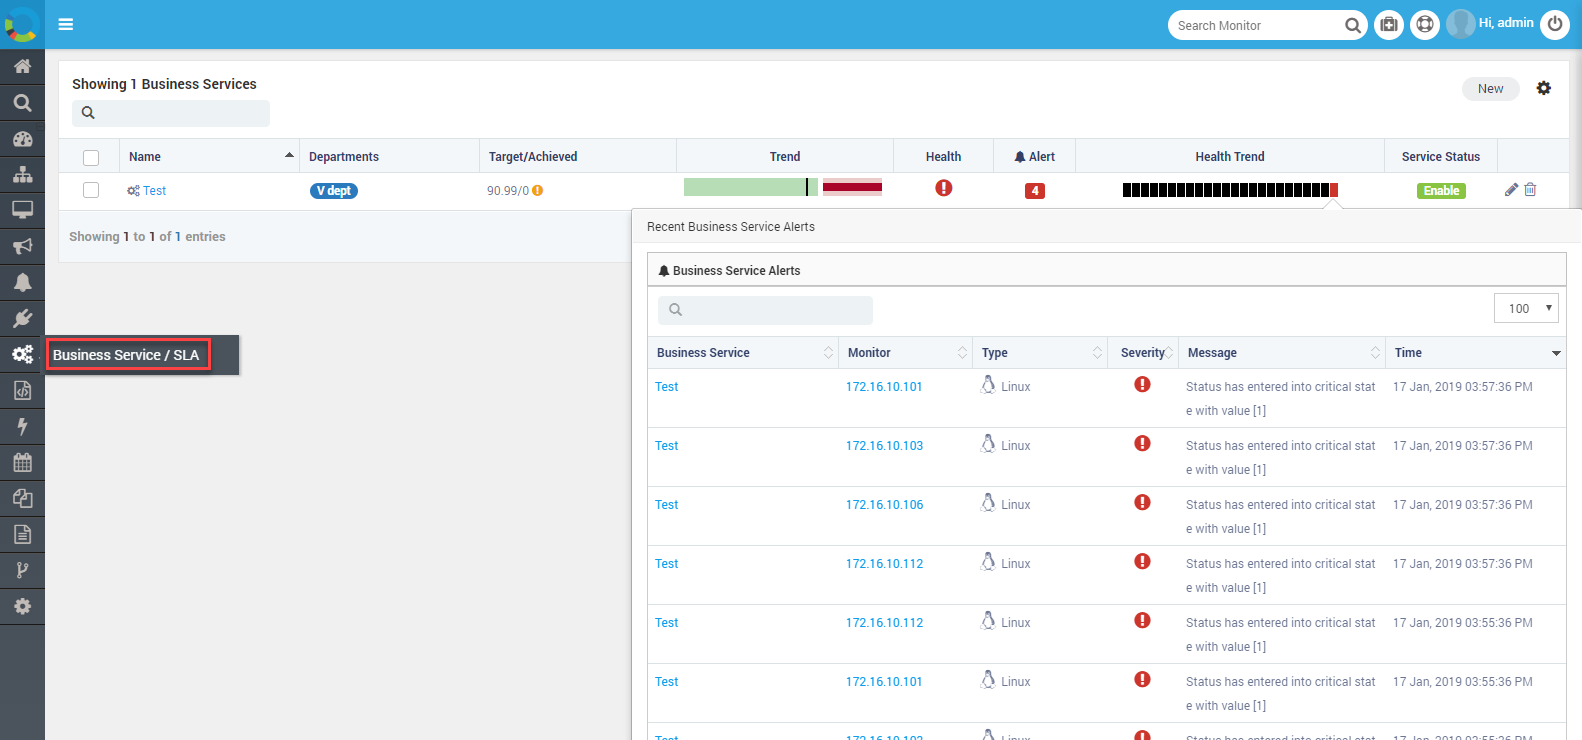
SLA Dashboard
Create New BSM
To create a new SLA, click on the ‘New’ button on SLA Dashboard. Motadata will open the SLA create page for you to configure SLA.

Button to Create New BSM
Prerequisites
To create an SLA, there are some settings required to be configured:
Plugins required: Business SLA Report Job (for SLA reports)
SLA-Engine should be ON from backend
Business hours should be configured
Basic SLA Details
Service Name: Type the name of the service. This will help you recognize the SLA from Dashboard and while creating the schedulers.
Department(s): Select the departments to manage the access of SLA to specific group of users. People of the selected department can only view/access the SLA.
KPI Threshold and Monitors
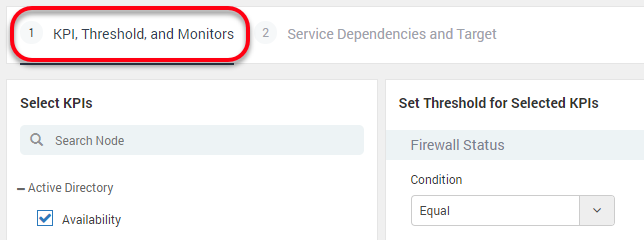
Define KPI Threshold and Monitors
Key Performance Indicator (KPI) is the measure of all components for a business service. We define the KPI through following steps:
Identify the monitor source type: Motadata rules for managing a monitor are designed based on their source types (e.g. Linux monitors, windows monitor etc.)
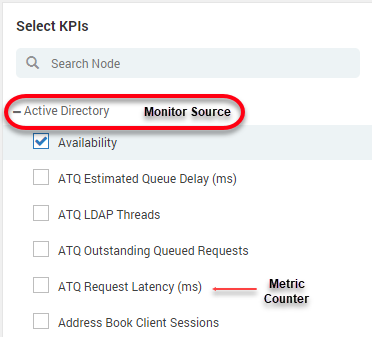
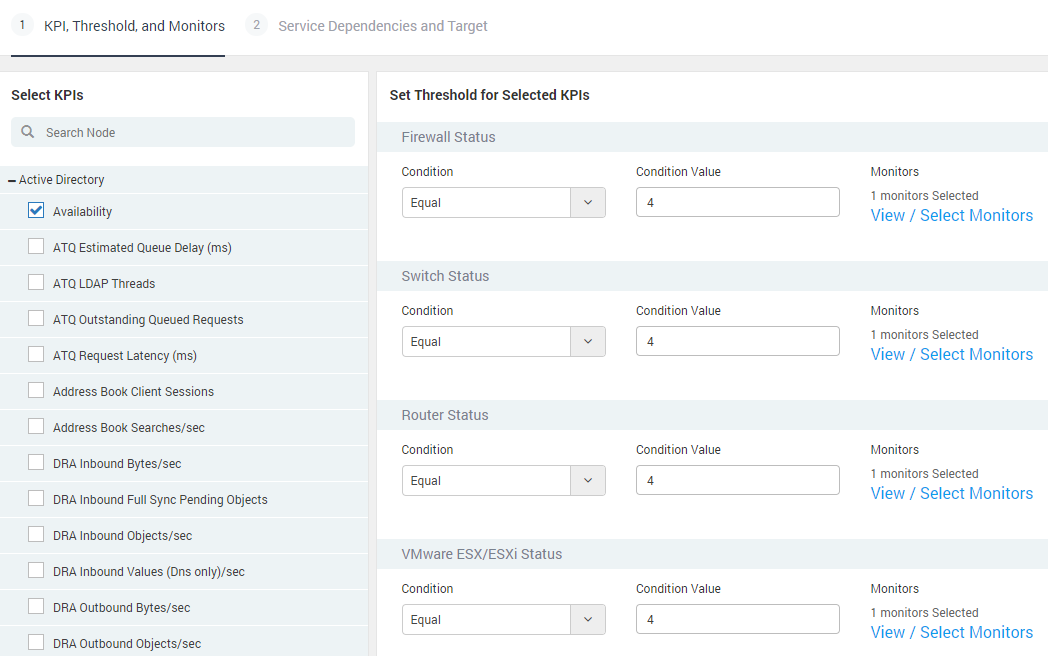
Select KPI
Select the metric values: For each source type, there are some metrics to evaluate the performance of the source.
Set the threshold value for the metric: The threshold value you put for the metric is compared with the actual metric value polled from the monitor. Based on the comparison, performance of the BSM is measured.
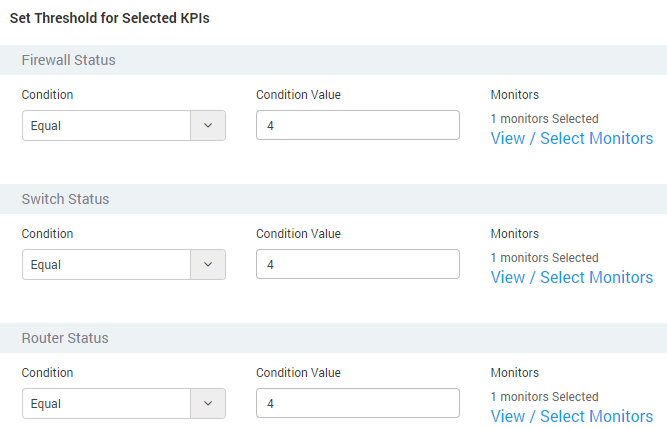
Select Threshold for KPI
Select the list of monitors (for the selected metric values): Motadata will evaluate the metrics of your selected monitors for the BSM. Motadata will show you the list of monitors based on the source type and counter metric. You can select any number of monitors from there.
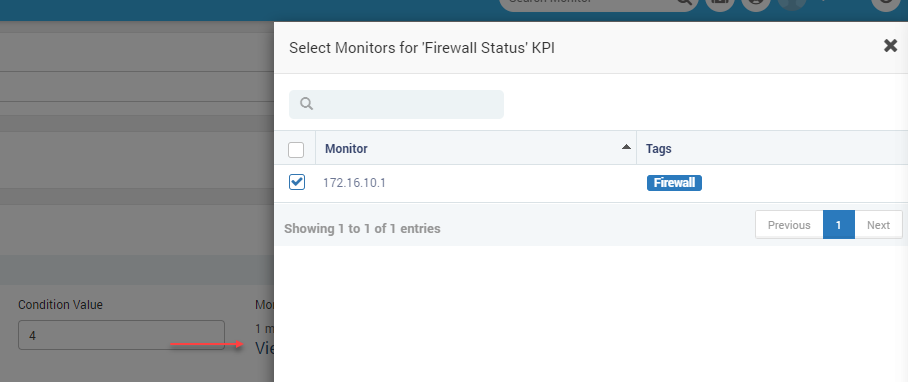
Select Monitors
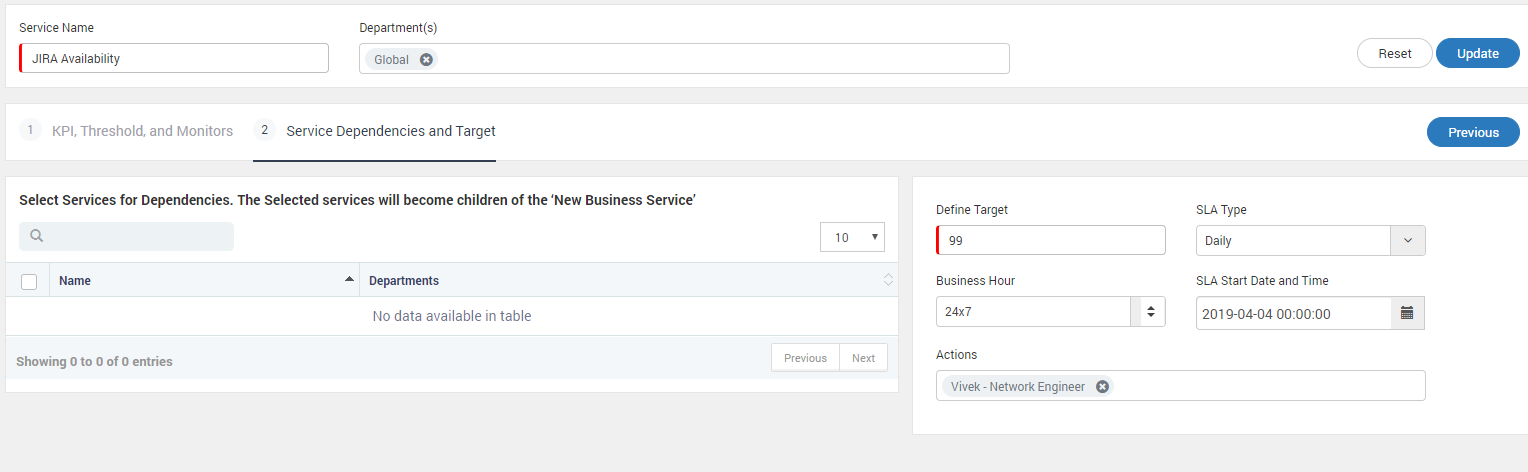
Service Dependencies and Targets
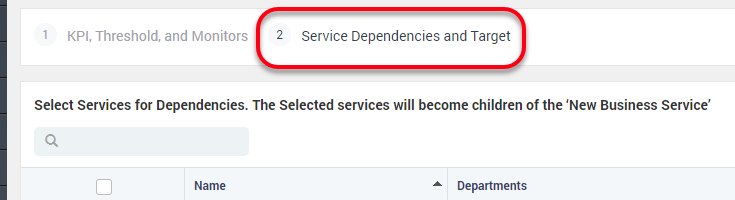
Service Dependencies and Targets
This section has two parts: Service Dependencies and Target
Service Dependencies
Service dependencies are used when one business service is dependent on another business service. The service dependencies used parent-child nesting. You can add existing business services as the child to the current business service.
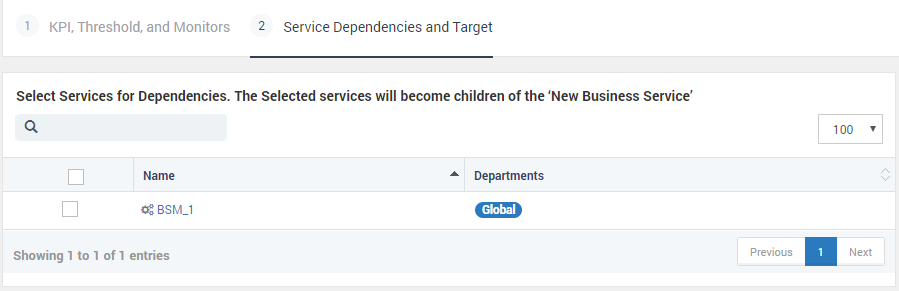
Select Existing Services
When you add the child business service, the SLA target of the current business service considers their output for SLA calculation.
Target
Business service target is the computation of SLA duration and performance of it. As the BSM measures the health as Critical or Clear, the SLA will be violated if even the one metric counter is not in ‘clear’ state for a given time. This time is auto-computed based on the target parameters.
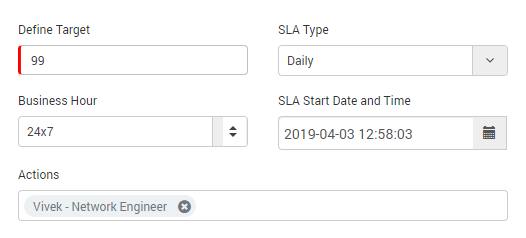
Define Target
Define Target: Provide Target Value (between 0-100 and floating value for threshold up to five Digits). This is the threshold for a SLA to be in clear state. For example: If SLA Target is 80% and KPI is availability, all monitors should be up 80% to achieve SLA.
Select SLA Type: Daily, Weekly, Monthly, and Quarterly. Based on your selection, new SLA cycle will run after time period is complete. For example: In above statement, if SLA type is daily, all monitors should be up 80% each day to achieve SLA. New cycle will start from next day.
Select business hours: SLA is computed in these hours. For example: In above statement, if business hours is 10 AM to 7 PM, all monitors should be up 80% each day between 10 AM to 7 PM to achieve SLA.
Select SLA Start Time: Default it takes server’s current time for calculation. On this date and time, Motadata will start SLA process.
Select Email actions Motadata will send an email about SLA on goings to this email. You can select multiple email actions also.
Business Hour Logic: If user changes in Business Hours, then also Business SLA will reset. While updating Business Hours, User should be given warning regarding Business SLA Reset. Upon deleting Business Hour, Related Business SLA will stopped and default Business Hour i.e. 24/7 is assigned to SLA.
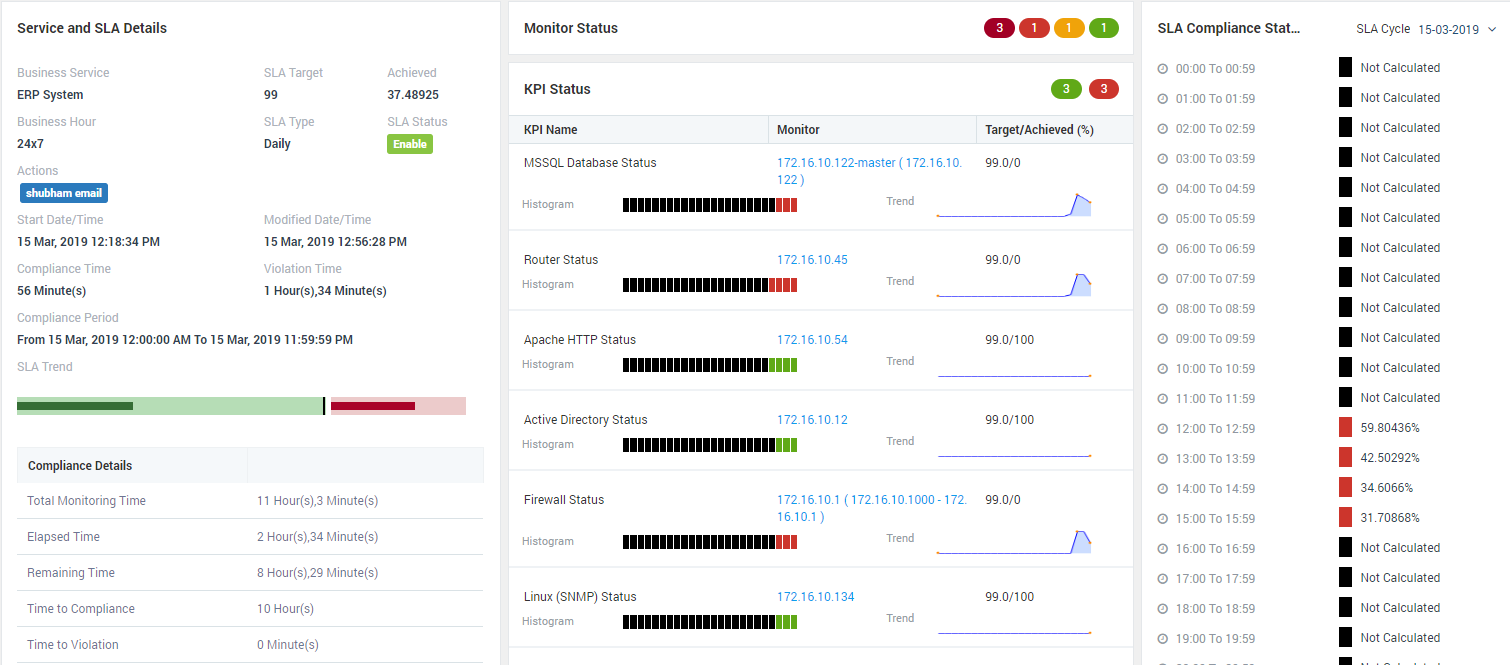
BSM Details Page
Click on the SLA name from index page to go to details page. You can view all the details of SLA i.e. Monitor Status, KPI status, KPI Details with histogram on details page.
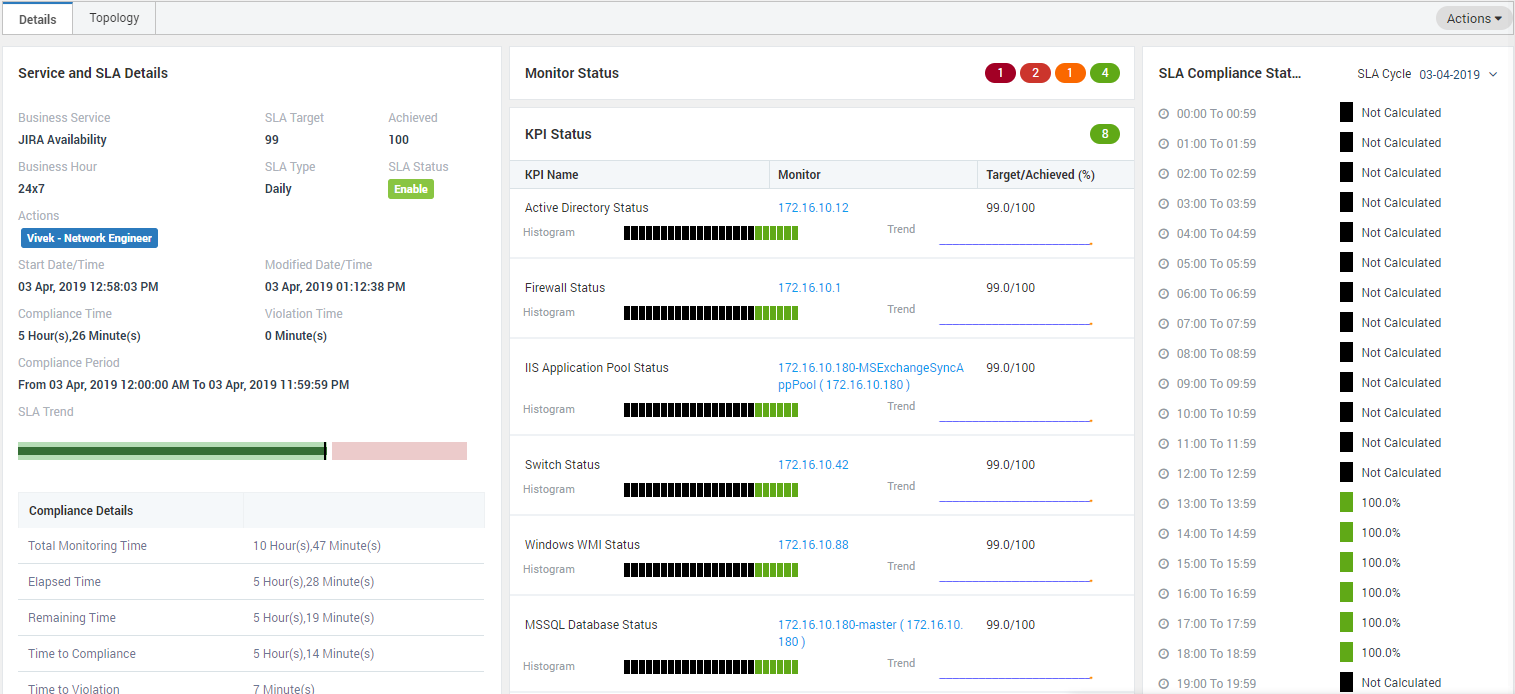
BSM Details Page
Service and SLA Details
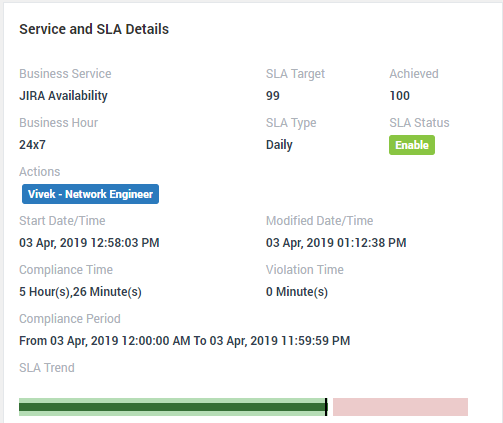
Service and SLA Details
Business Service |
Display name of the SLA |
SLA Target |
The target value SLA should achieve to prevent violation |
Achieved |
Percentage of SLA (%) achieved |
Business Hour |
Business hours in the day for which SLA runs |
SLA Type |
Time period of one complete cycle of SLA |
SLA Status |
Status of the SLA (Enable/Disable) |
Actions |
Name of the actions associated with SLA |
Start Date/Time |
Date and time when SLA started |
Modified Date/Time |
Date and time when SLA configuration is changed |
Compliance Time |
Total time for which SLA complied |
Violation Time |
Total time for which SLA didn’t complied |
Compliance Period |
Start date/time and end date/time of SLA |
SLA Trend |
Graphical representation of SLA is clear and violated |
Compliance Details
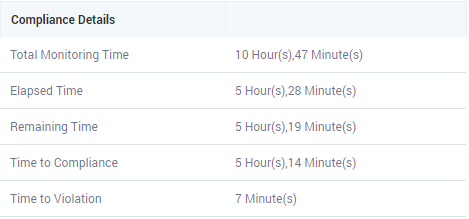
Compliance Details
Compliance details are the time computation for SLA. Please download above document for field description and formulas used to compute them.
Business Service Layer Details
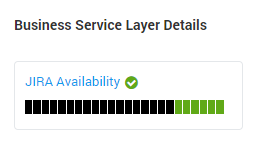
Business Service Layer Details
The section shows all the BSM(s) (parent and child) in this section. You can create a Nested Business service views for more complex business services running in enterprise network. In order to do this, you should first create low level business service and then add all the low business service into a new higher level business service. Parent SLA’s Health severity depends on Child SLAs severity, KPI details and health trend.
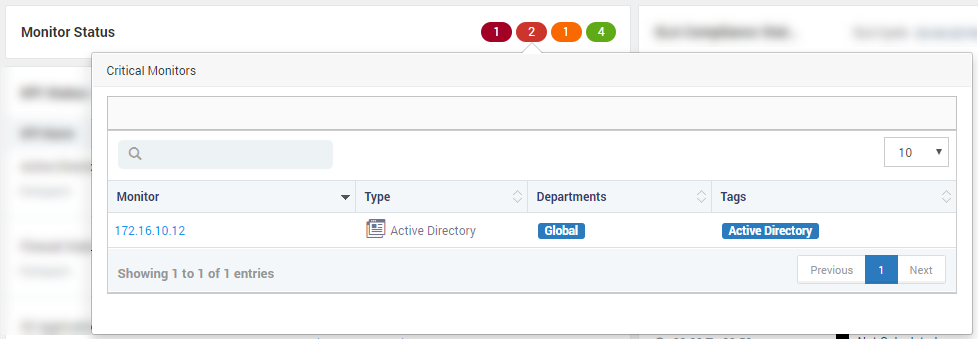
Health Report
The section shows all the monitors that are not in clear state and can result in SLA violation. Click on the number to see the details of the monitors.
KPI Status
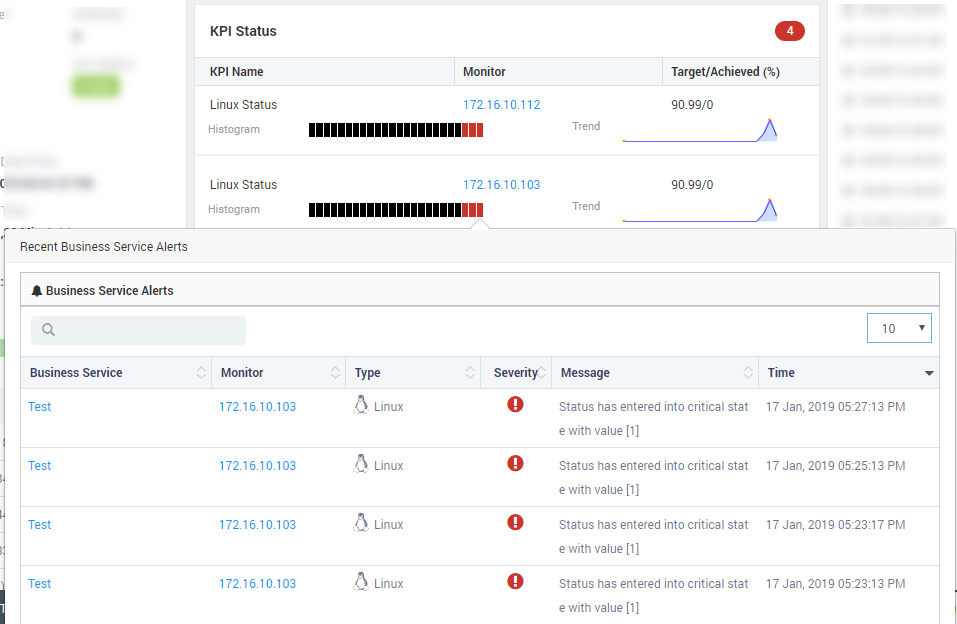
KPI Status
The section shows the performance of monitors for each KPI. If any of the monitor in the KPI doesn’t meet the threshold, the KPI will show in critical state. The bar of each KPI shows the KPI status of last 24 hours. Click on any bar to see the monitors under that KPI.
Example
We have used a dummy JIRA stack as the business service. The service uses following components:
Firewall
Router
Switch
Virtual Machine
Windows Server
Database Server
Active Directory
IIS
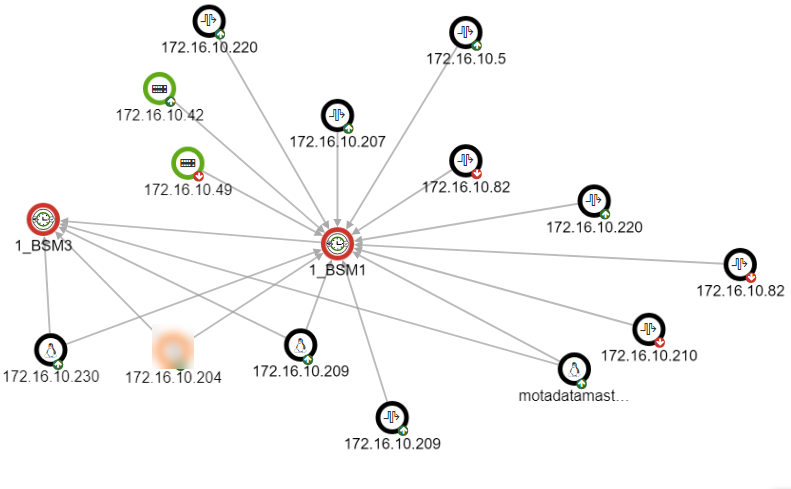
Topology
Motadata has introduced the logical BSM widget topology diagram once you create BSM and associate discovered network devices with it. For a better visualization of the monitor’s connectivity in real networks, BSM widget topology map comes handy. Motadata topology purely relies on connectivity of the nodes and links in the network.
Key Features
Get the all devices into BSM Topology in Seconds.
Auto-detect the fired alerts information to BSM topology in the form of colors displaying.
Detect BSM and device severity and health information from the color displaying.
Get device health information with the single click.
Screen Layout
The diagram shows the status of monitors using color codes. When monitor status is critical, the circle is red. When the monitor status is clear, the circle is green.
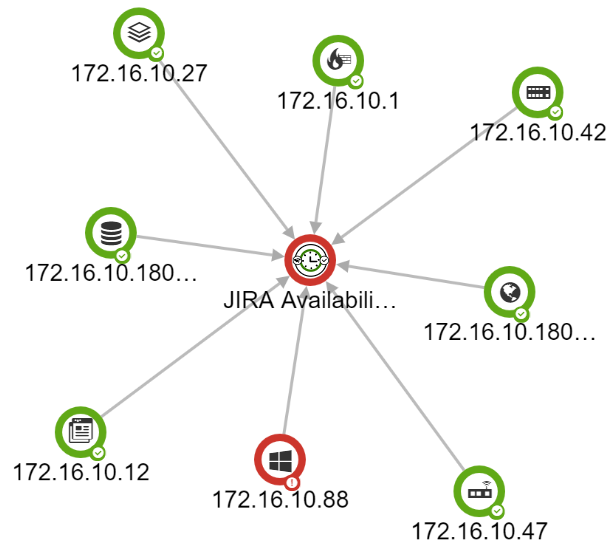
Screen Layout
You can detect BSM health from color on outer ring of BSM.
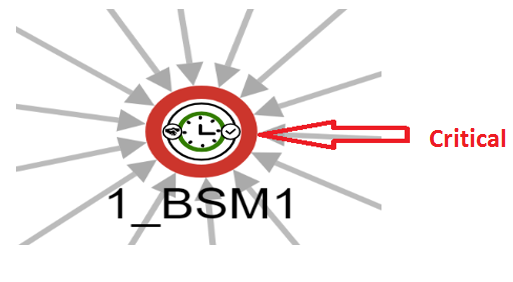
BSM in Critical Health
You can check monitor’s information by clicking on the monitor that will show you monitor slider.
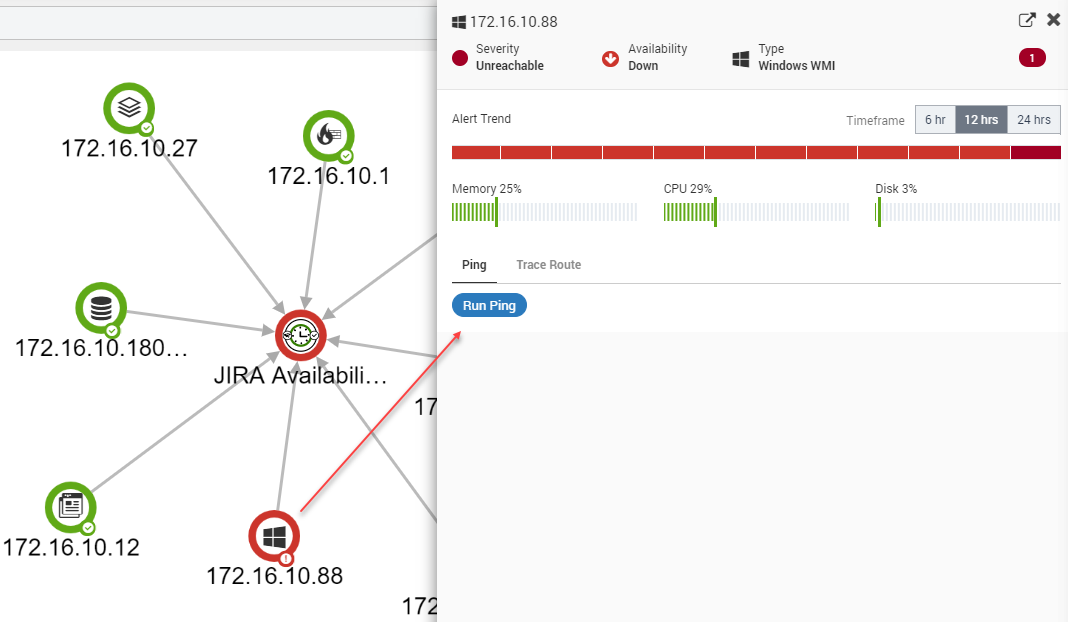
Quick Monitor Details
You will see nested BSM topology if BSM has children or parent BSM(s) available.